Visualise mobility changes before they happen.
Plan the fix.

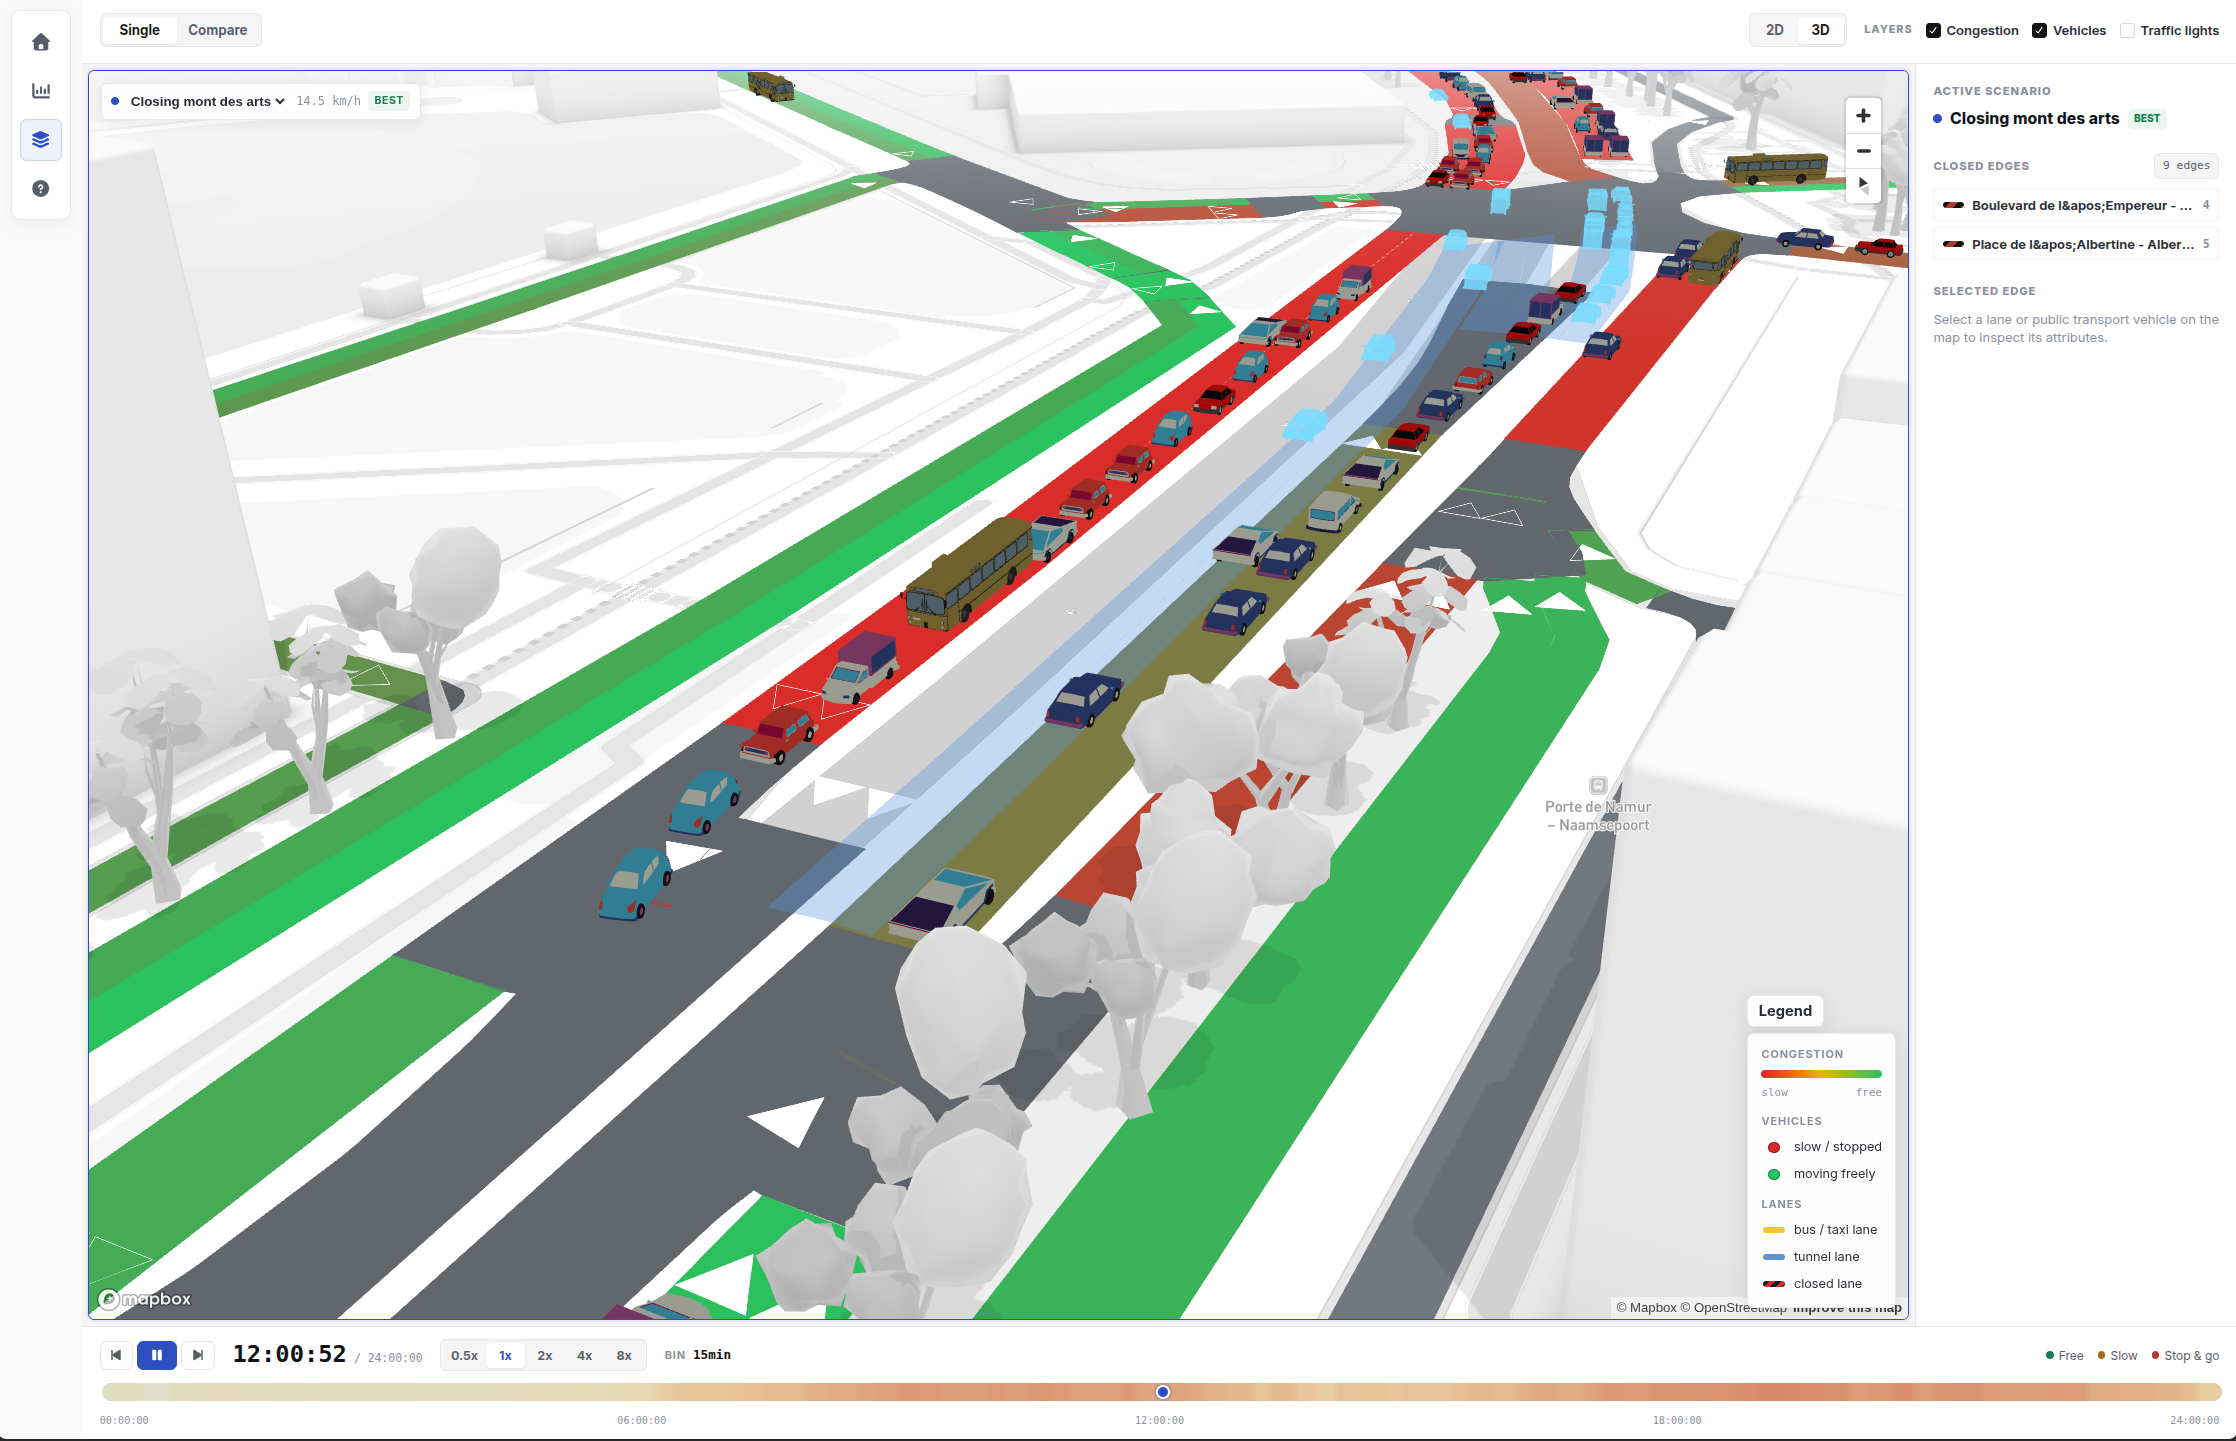
TrafficTwin helps understand how a road closure, event, or public transport change can affect traffic. You can compare options, see the impact on a map, and discuss decisions with clearer evidence.

Traffic planning dashboard with city roads, route lines, and comparison panels

A practical way to compare mobility options.

  • Plan road closures with less guessworkTest roadworks, events, and temporary traffic deviations before they are used.
  • Visualise and compare different mobility scenarios Compare public transport changes, traffic lights, lane speeds, lane closures, diversion plans,...
  • Share results people can readUse maps, visualisations, and various mobility indicators to support the discussion.

Case studies already available.

Tunnel Louise · morning traffic09:00
Loading Tunnel Louise simulation…
Recorded simulation · baseline · 10× playback

Who developed it

The TrafficTwin was developed by the Machine Learning Group of the Université Libre de Bruxelles in collaboration with FARI and the Université Aix-Marseille.

Université Libre de BruxellesMachine Learning GroupFARIUniversité Aix-Marseille

Contributors

Siméon Michel · Davide Guastella · Eladio Montero Porras · Gian Marco Paldino · Natalia Garcia Colin · Alejandro Morales Hernández · Gianluca Bontempi

It is currently funded by the EDITS project ( FNRS, WEL-T ) and SPW Proof Of Concept Grant. It was previously funded by Innoviris .


WEL-TSPW RechercheInnoviris

Bring your own mobility question.

TrafficTwin is most useful when there is a real decision to prepare: a closure, a diversion plan, a major event, or a public transport change.

Start a discussion