Why Place Meiser?
Place Meiser, in Schaerbeek, is where the Brussels middle ring (Boulevard Auguste Reyers and Boulevard Général Wahis) crosses Chaussée de Louvain. Six roads come in and six go out around a large roundabout, which tram tracks cross diagonally, with the Reyers–Meiser tunnel underneath. Avenue Rogier, Avenue Eugène Plasky and Rue Cambier also join it.
In its presentation of the project, Bruxelles Mobilité lists the problems of today’s square:
- it is hard to read for everyone who crosses it, and hard to reach on foot and by bike;
- it is one of the region’s priority accident hotspots, with 43 accidents with injuries in 2010–2013 and 34 in 2017–2020;
- 95% of the ground is sealed and there is very little greenery;
- public transport could run better, and the square suffers from air and noise pollution.
The Region’s goals are to make the square safer and easier to use for every mode, to turn it into a quality public space, and to manage rainwater on site with more greenery and permeable ground.
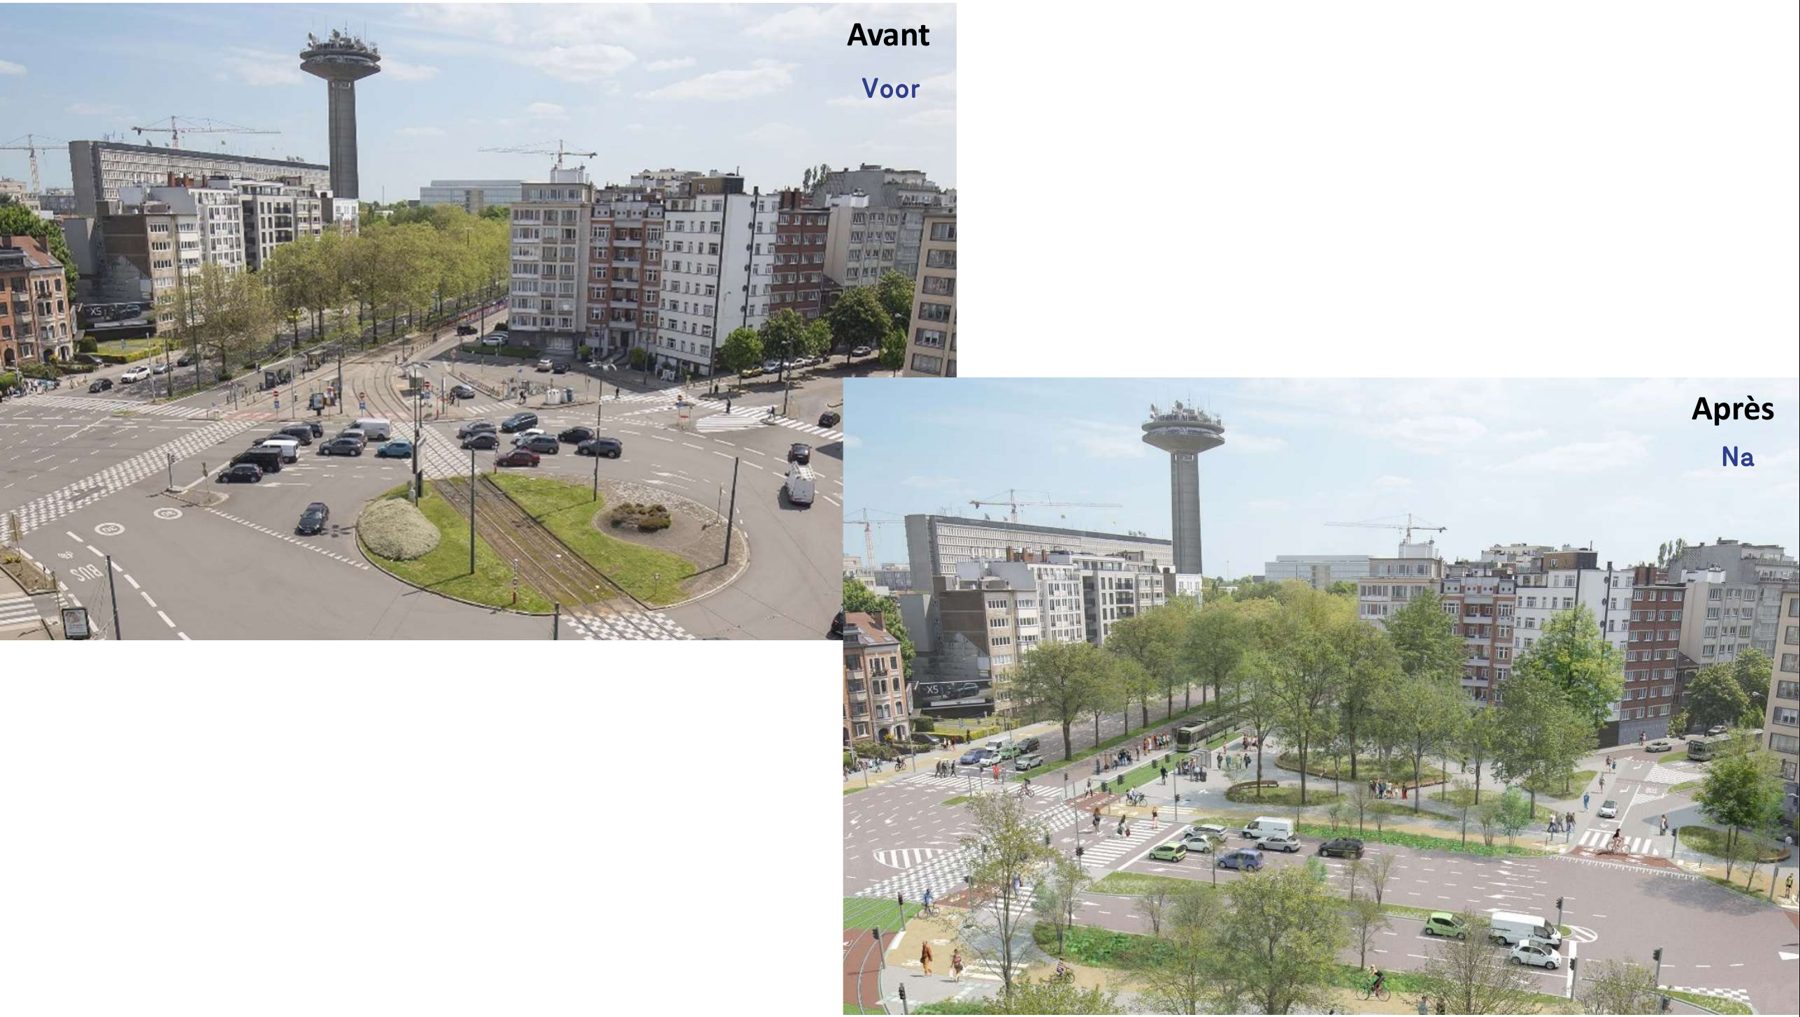
Place Meiser today and as imagined after the works. Images: Bruxelles Mobilité, presentation of 11 December 2023.
What is the redesign?
Bruxelles Mobilité compared four scenarios in a mobility study and presented the selected one in a public presentation on 11 December 2023 (design of September 2023). A planning permit application was filed in June 2023; the project page lists the project as under study. The main changes are:
- two signal-controlled junctions replace the roundabout: one where Wahis meets Reyers, one where Rogier, Chaussée de Louvain and Plasky meet;
- a central axis between them with five lanes towards the suburbs and three towards the city centre;
- the two bypasses are replaced by right-turn lanes at the Wahis/Reyers junction;
- the Meiser–Cambier link is removed, and the connections to Avenue Rogier and Avenue Plasky are narrowed;
- the diagonal tram line through the square is replaced by a Y-shaped tram junction.
The space this frees makes room for about a hundred new trees, and around a fifth of the square becomes permeable again.
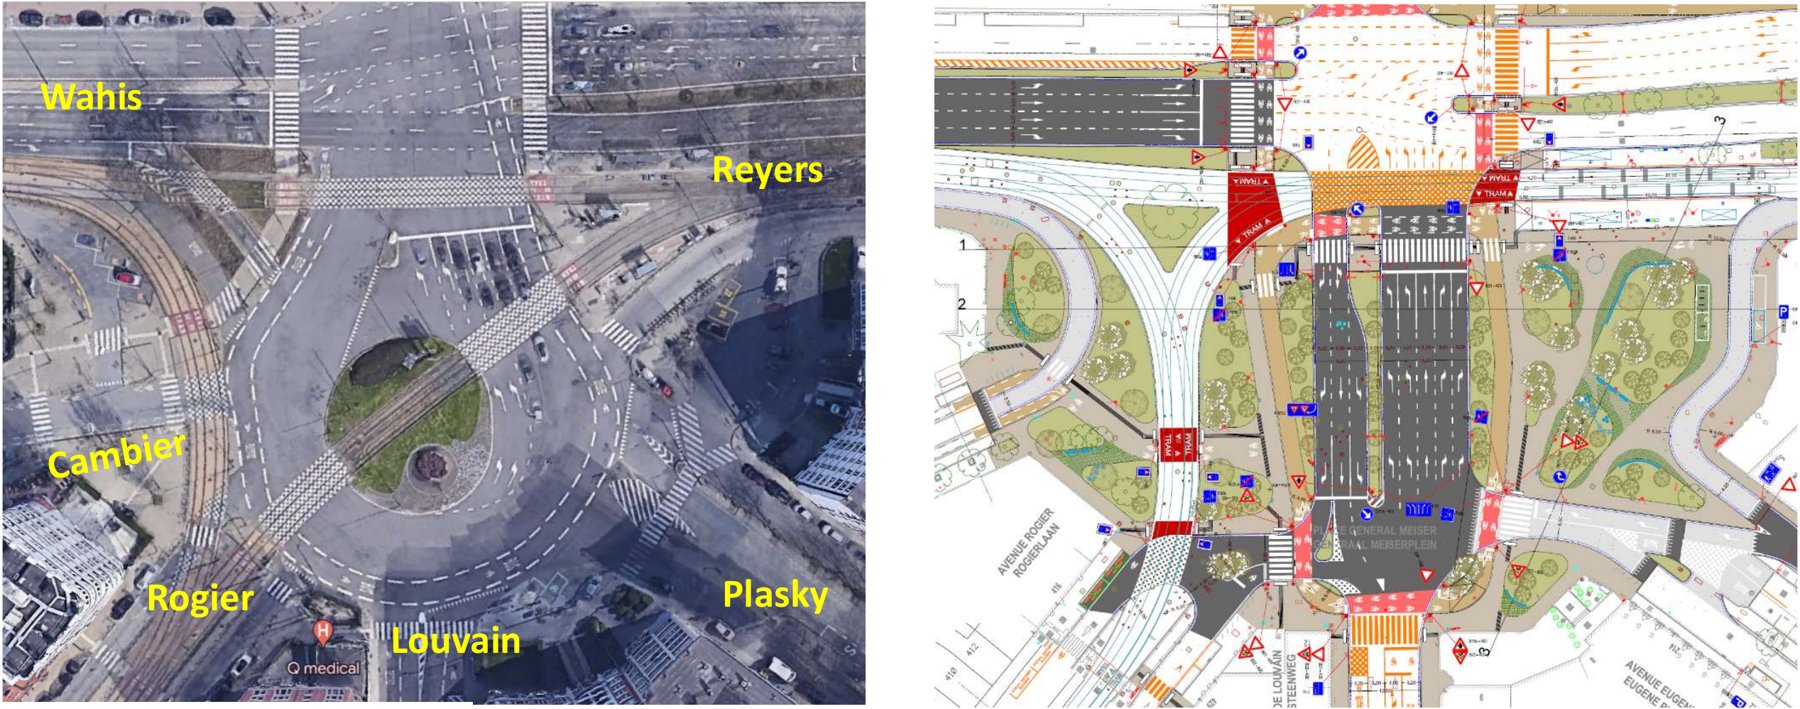
Today’s roundabout (left) and the selected design (right). Images: Bruxelles Mobilité.
This case study asks a narrower question: with today’s traffic, what would the new layout change for drivers and bus passengers in and around the square?
To test it, we drew this layout onto our model of the Brussels road network, using the presentation’s detailed drawing. The number of lanes and the turn arrows on each lane are read from that drawing. On Chaussée de Louvain, for example, each direction has one general lane and one outer bus lane, and the general lane towards the square is marked straight-ahead or right. Positions are approximate: the drawing is a planning document, not a surveyed plan.
How do the bus routes change?
Lines 12 and 63 went round the roundabout. With the redesign they cross the square through the two new junctions along the central axis. We rerouted them automatically: wherever the new layout cuts a bus route, the bus takes the fastest path open to buses that brings it back onto its route. The new paths are about as long as before.
Their MEISER stops stood on roads that disappear. They move to the closest point of the new route, 7 to 48 metres from where they are today.
The other lines crossing the study area (21, 28, 29, 56, 61, 64, 65, 79 and 80) keep their routes. Trams 7 and 25 are not part of this simulation.
How was it simulated?
We compared today’s layout with the redesign over a full weekday, from 00:00 to 24:00, with a microscopic simulation in which every vehicle is modelled individually. The two scenarios differ only by the road layout:
- Same traffic in both. The same 38,294 car trips cross the area over the day. Nobody changes mode, leaves at another time or stops making the trip because of the redesign. Drivers choose their route on each layout, and 40% of them can change route during the trip when they meet congestion.
- Buses run to the STIB timetable of Monday 26 October 2026: 1,970 bus trips over the day, stopping at their stops. Lines 12 and 63 follow the diversions described above.
- Study area: the roads within 0.5 km of the redesigned roads, a circle of about 840 metres around Place Meiser. Traffic enters and leaves at its edge.
- Traffic lights: existing signals keep their current programs. The two new junctions run programs generated by the simulator, which adjust to traffic, not the project’s own signal plans, which are not published.
- Not simulated: trams, cyclists and pedestrians, and the construction period.
- One run per scenario, with the same random seed. Results are indicative: a different seed would move them a little.
Because the redesign removes some roads and rebuilds others, the redesigned roads cannot be compared one by one. They are compared as one zone, and shown in purple on the difference map.
The replay below shows the same simulated day on both layouts at the same moment: today on the left, the redesign on the right. It starts at the time the two plans differ most. Move or zoom one map and the other follows.
What changes for traffic?
Over the day, the redesign clearly improves traffic across the study area. Total time lost in traffic falls by 24%, from 493 to 376 vehicle-hours. Average trip time falls by 5.6%, and the longest trips (95th percentile) by 13%. Average speed rises from 29.3 to 30.9 km/h, and CO2 emissions fall by 3.9%. Every trip reaches its destination in both scenarios.
In the redesigned zone
Most of the gain comes from the square itself. The two junctions replace the 51 road sections of today’s square with 24 new ones. Vehicles cover about 12% less distance there, because paths across two junctions are shorter than paths around the roundabout. Their average speed rises from 24.3 to 26.2 km/h, and time lost in the zone falls by about a quarter, from 202 to 154 vehicle-hours over the day.
Through the day
The share of congested road length is lower with the redesign during both peaks. Around 09:00 it falls from 4.7% to 3.4% of road length, and at 17:00 from 5.3% to 3.6%.
The redesign does worse in one interval only: 18:30 to 18:45, about 0.7 points more congested road than today. Queues then build up from the new junctions onto Boulevard Général Wahis (about 4 km/h slower) and Chaussée de Louvain (2 km/h slower). Over the whole day, speeds on the surrounding streets change by less than 1 km/h almost everywhere. The maps below show the average conditions on each road over the day for both layouts; switch to Difference to see where the redesign is faster or slower.
What changes for buses?
Over the day, 1,970 bus trips cross the area and 99.7% of them complete in both scenarios. Over all of them, the average running time in the area falls slightly, from 4.58 to 4.50 minutes, and time lost in traffic falls from 72 to 69 seconds per trip.
- Clearly faster: line 12 towards Brussels City (−33 s per trip), line 79 towards Kraainem (−29 s), line 21 towards Maes (−25 s) and line 63 towards Gare Centrale (−14 s).
- Slightly slower: line 21 towards Luxembourg (+7 s), line 12 towards Brussels Airport (+5 s) and line 29 towards De Brouckère (+4 s).
The lines that cross the square now wait at the new traffic lights instead of merging into the roundabout. Their running times would depend directly on the final signal plans, including any bus priority.
What do the results mean?
With unchanged traffic, the two-junction layout handles a full weekday better than today’s roundabout. It loses less time in the square, relieves both peaks and slightly speeds up most bus lines. It struggles only briefly in the early evening, on Boulevard Général Wahis and Chaussée de Louvain. Bus lines 12 and 63 can be rerouted through the new junctions without detours, and their stops move only a few dozen metres.
These are comparative simulation results, not forecasts. Three points matter most before drawing conclusions:
- The signal plans of the two new junctions are placeholders. The project’s real timings, including bus and tram priority, could change the results in either direction.
- Traffic is held constant. A redesign often changes how many people drive and when, and that is not modelled here.
- A single run per scenario gives an indication. Several runs with different seeds would show how robust the differences are.