Which signal strategy works best at Albert Ier / Cauchy?
This study compares four signal programs for one junction in Namur: the crossing of Avenue Albert Ier, Boulevard Cauchy, Avenue Comte de Smet de Nayer and Place de l’École des Cadets, near the station. Everything else is identical between the four simulations: the road network, the demand and every other traffic light. Only the program of this junction changes.
The simulation covers a full day (17 September 2026 demand) in microscopic mode, on a 1 km area around the junction. The road demand was calibrated using Telraam counts across Namur, but no counter is located on the approaches of this junction: the volumes it receives come from the calibrated model, not from a local count. The “current program” is the program of the modelled network, not the signal plan actually used by the city.
What does the junction carry?
About 12,500 vehicles a day cross the junction in the simulation. Demand is very unbalanced between its approaches:
| Approach | Vehicles over 24 hours | Share |
|---|---|---|
| Avenue Albert Ier | 7,301 | 58.5% |
| Boulevard Cauchy | 2,906 | 23.3% |
| Avenue Comte de Smet de Nayer | 2,158 | 17.3% |
| Place de l’École des Cadets | 110 | 0.9% |
The current program nevertheless gives each group of approaches a fixed green of 23 seconds in a 90-second cycle: Boulevard Cauchy and Avenue Comte de Smet de Nayer (plus 6 seconds of protected left turns), then Avenue Albert Ier, then Place de l’École des Cadets. A quarter of each cycle goes to an approach used by fewer than 15 vehicles an hour.
Which strategies are compared?
All four programs keep the same stages, the same 3-second yellows and the same 1-second all-red. Only the length of the greens and the way it is decided change.
- Current program (fixed): 23 s per stage, 90 s cycle.
- Fixed time, re-split by demand: still a fixed 90 s cycle, but the greens follow peak demand: 44 s for Avenue Albert Ier, 19 + 6 s for Boulevard Cauchy and Avenue Comte de Smet de Nayer, 6 s for Place de l’École des Cadets.
- Actuated (delay-based): each green lasts between a minimum and a maximum (8–50 s for Avenue Albert Ier, 8–40 s for Cauchy and Comte de Smet de Nayer, 4–20 s for the Cadets) and is extended while approaching vehicles accumulate delay.
- Actuated (gap-based): the same limits, but a green ends as soon as detectors see a gap in arriving traffic.
The programs were built with TrafficTwin’s traffic-light editor, as network plans applied to the same baseline. The replay below shows the junction during the morning peak; switch between plans to compare how the signals and queues behave.
How much time does each vehicle lose at the junction?
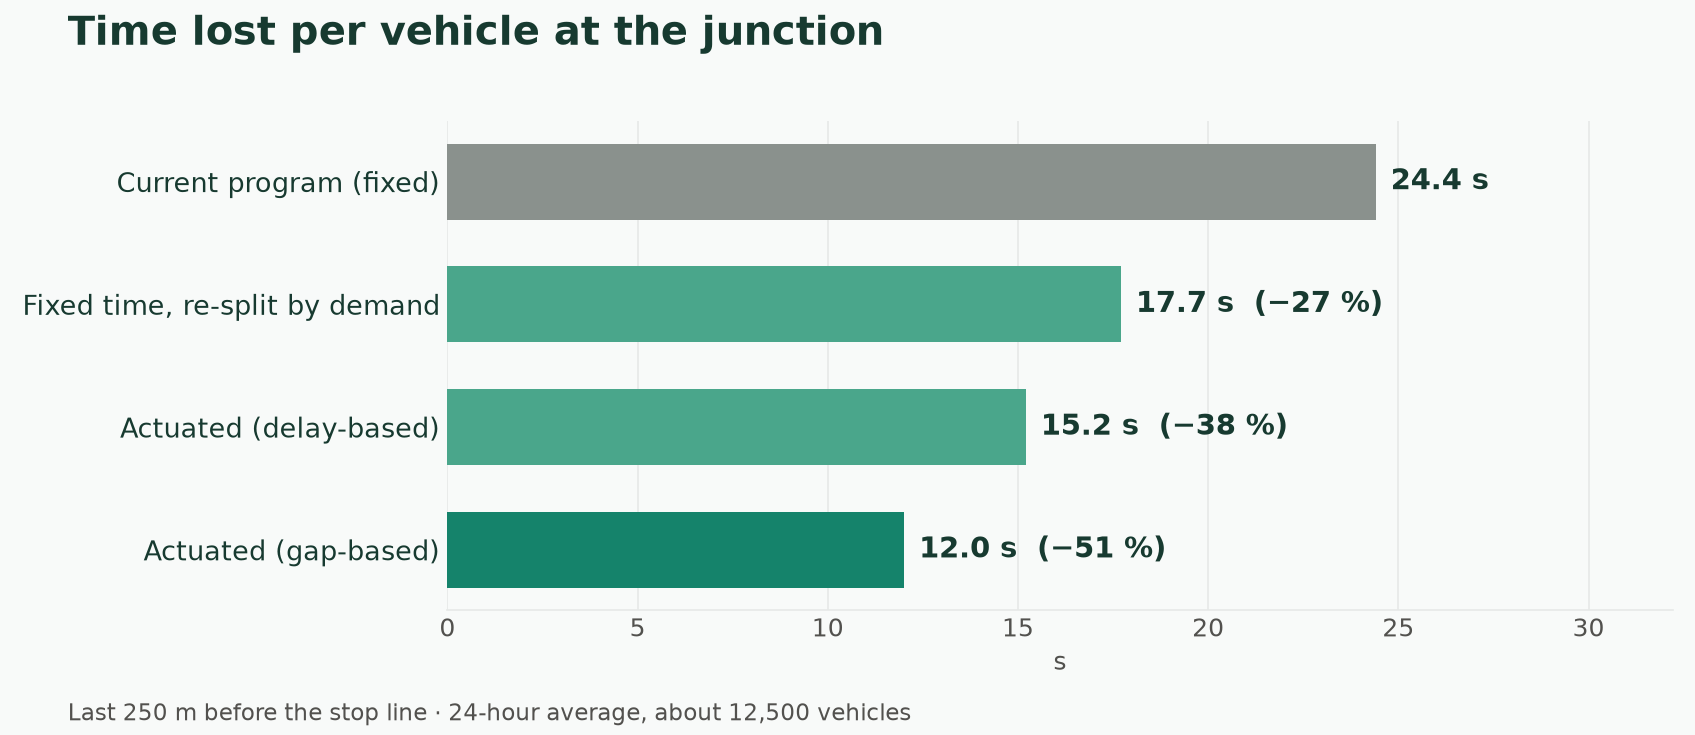
The indicator is the time lost by each vehicle over its last 250 metres before the stop line, compared with driving at the speed limit. It is computed from the second-by-second trajectory of every vehicle crossing the junction, and attributed to the approach it actually used.
| Over 24 hours | Current | Fixed, re-split | Actuated (delay) | Actuated (gap) |
|---|---|---|---|---|
| Mean time lost per vehicle | 24.4 s | 17.7 s | 15.2 s | 12.0 s |
| Time lost by the 5% most delayed vehicles (95th percentile) | 61.9 s | 58.9 s | 61.1 s | 28.9 s |
| Mean time stopped per vehicle | 21.4 s | 15.3 s | 12.8 s | 9.2 s |
| Vehicles that stop at least once | 64.9% | 54.8% | 54.6% | 65.4% |
| Total time lost at the junction | 84.6 veh·h | 61.8 veh·h | 53.0 veh·h | 42.3 veh·h |
Gap-based actuation halves the time lost at the junction. It is also the only strategy that cuts the longest waits: the 5% most delayed vehicles lose 29 seconds instead of 62. About as many vehicles stop as with the current program, but their stops are much shorter, because an empty approach no longer holds a 23-second green.
Who gains, and who loses?
| Mean time lost per vehicle | Current | Fixed, re-split | Actuated (delay) | Actuated (gap) |
|---|---|---|---|---|
| Avenue Albert Ier | 26.6 s | 13.1 s | 9.0 s | 13.3 s |
| Boulevard Cauchy | 20.4 s | 23.4 s | 23.0 s | 9.0 s |
| Avenue Comte de Smet de Nayer | 22.4 s | 24.3 s | 24.0 s | 11.7 s |
| Place de l’École des Cadets | 25.5 s | 41.0 s | 37.7 s | 15.4 s |
The fixed re-split and the delay-based program mainly favour Avenue Albert Ier, the busiest approach, at the expense of the others: Boulevard Cauchy and Avenue Comte de Smet de Nayer lose 2 to 3 seconds more per vehicle, and the rare vehicles coming from Place de l’École des Cadets wait about 40 seconds. Gap-based actuation improves every approach compared with the current program.
The chart below explains why. For each turn and each plan, it shows the share of the day spent green, yellow and red, and the average length of one green. The fixed re-split and the delay-based program give Avenue Albert Ier long greens and leave the other approaches short ones; gap-based actuation gives every approach short, frequent greens.
Does the gain hold throughout the day?
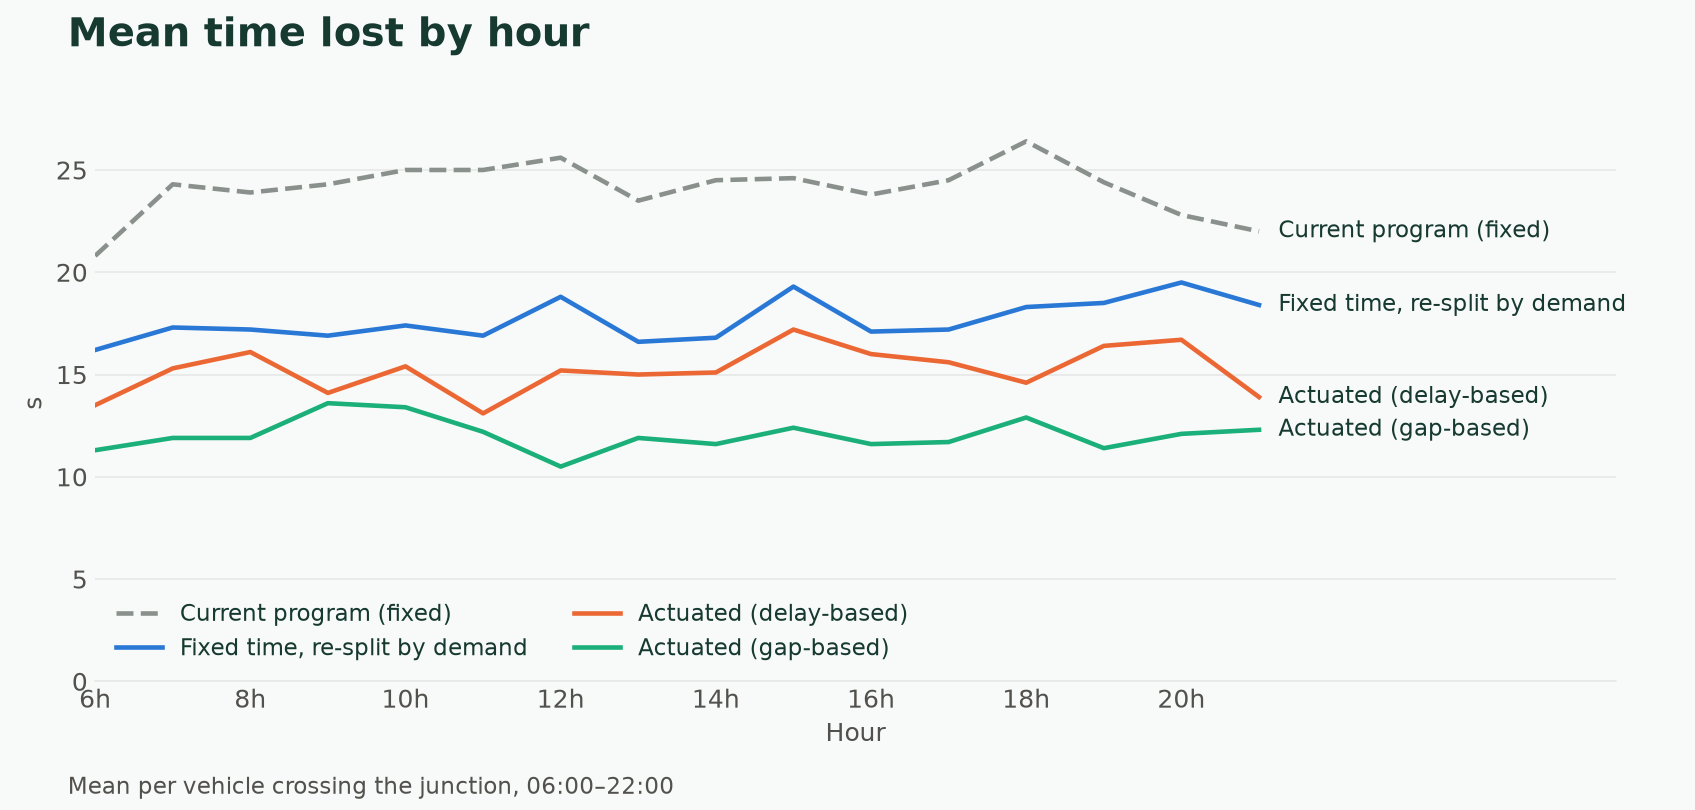
The ranking holds at every hour of the day, including the morning and evening peaks. With these volumes the junction does not saturate in the simulation: the gain comes from distributing green time better, not from adding capacity.
What does it change beyond the junction?
On the whole 1 km simulated area (about 54,000 trips), the total time lost falls by 9.7% with the fixed re-split, 12.9% with delay-based actuation and 25.4% with gap-based actuation. Road CO₂ falls by 0.8% to 1.5%: changing one traffic light mainly affects waiting time, much less emissions at the scale of a neighbourhood.
Limits of this study
- Local volumes are modelled. No Telraam counter checks the approaches of this junction.
- The current program is a modelling assumption. The real signal plan of the City of Namur may differ, including detectors already in place.
- Detectors are simulated. Actuated programs use SUMO’s default induction loops; real equipment, its placement and its faults are not reproduced.
- Pedestrians and cyclists are not simulated. A shorter or skipped green can matter for pedestrian crossing times, which this study does not measure.
- The demand is that of one day. Events, roadworks or a different season could change the ranking.