A low-emission zone in Namur: what does this study test?
This study compares two vehicle fleet compositions over the same simulated day of traffic in Namur: a reference estimate and a fleet in which vehicles below hypothetical LEZ thresholds are replaced. The analysis covers the city of Namur except for the E411 and E42 motorways, which would be outside a hypothetical LEZ. This is an exploratory scenario, not a LEZ adopted by the City of Namur or a forecast of air quality.
The simulation covers a full day on the modelled road network. Its road demand was calibrated using Telraam counts; 17 counters in the city’s area are matched to the modelled network. Emissions for both fleets are recalculated from the same trace of speeds and accelerations: trip numbers, routes and congestion do not change between the two calculations.
The simulation interface displays results for the whole network. For this case study, totals, the chart and the map were recalculated from road-level emissions after excluding roads classified as highway.motorway or highway.motorway_link in the SUMO network: 78 observed motorway segments and 76 ramp segments. Motorways remain visible in grey on the map to show the boundary. This is a filter on the results, not a new simulation with road-specific access rules.
How was the reference fleet estimated?
The starting point is the registered vehicle stock in Namur municipality, INS 92094, on 1 August 2025: 54,789 cars, 7,709 goods vehicles and 118 road tractors. Cars account for about 87.5% of these selected categories. Buses, two-wheelers, agricultural and special vehicles are excluded from this road fleet composition.
Without a local split between vans and heavy goods vehicles, the 7,827 goods vehicles and tractors are divided using FEBIAC’s Belgian stock at the end of 2025: 915,328 vans to 91,359 trucks and road tractors. This yields approximately 11.37% vans and 1.13% trucks in the total fleet. It is a national ratio applied to Namur, not a count on its roads.
For cars, IWEPS data on the Walloon fleet in 2025 give 34.4% diesel and 2.1% battery electric. The remaining 63.5% is represented by petrol models. As a simplification, this remainder also includes hybrids and less common powertrains; their real operation is not reproduced.
The Euro-standard distribution does not come from a Namur vehicle count. It uses SUMO’s generic HBEFA4 weights, dated 2022, grouped by fuel and standard. Vans use N1-II profiles; trucks and tractors use rigid-truck profiles of up to 7.5 tonnes. The reference fleet has 50 profiles, including pre-Euro vehicles. Registered-vehicle shares are used as probabilities when assigning profiles to trips, although through traffic, commuters, leasing registration locations and different annual mileages can substantially change the fleet actually circulating in Namur.
How was the hypothetical “LEZ” fleet built?
As an experiment, the second fleet applies the Brussels LEZ access thresholds for 2026 to the Namur reference: petrol cars and vans must be Euro 3 or newer, diesel cars and vans Euro 6, and diesel heavy goods vehicles Euro VI. Older profiles, including Euro 2 petrol vehicles and Euro V trucks, are removed. This does not describe any access rule in force in Namur.
Each removed share is redistributed proportionally among allowed profiles of the same vehicle category and fuel. The resulting fleet has 26 profiles. The overall car, van and truck shares, as well as the petrol, diesel and electric shares, remain unchanged. The scenario therefore assumes one-for-one replacement, with no cancelled trips, modal shift, additional electrification, exemptions or non-compliance.
How much do emissions fall?
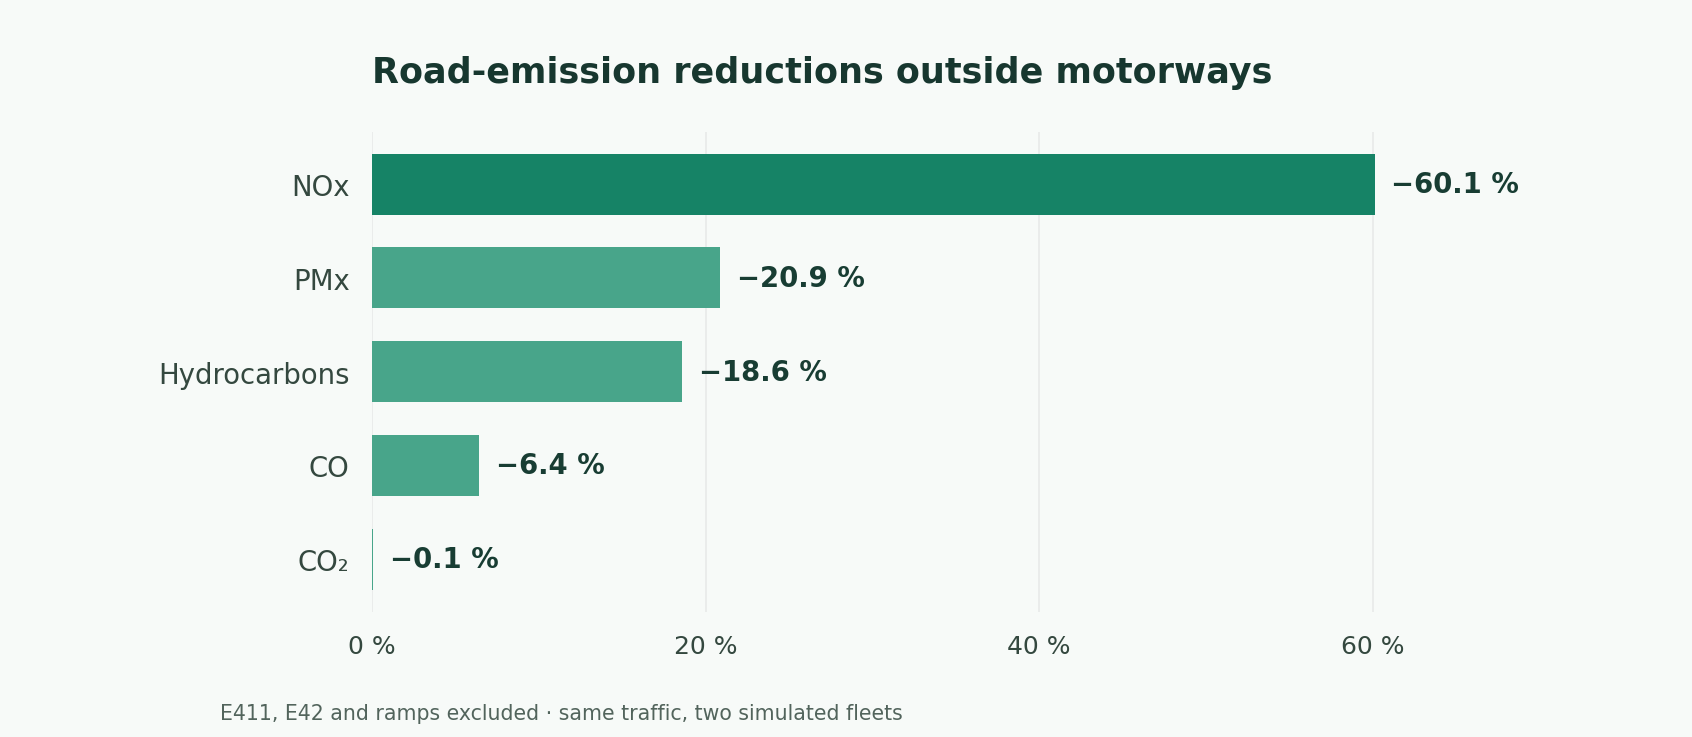
| Road emissions over 24 hours, excluding E411, E42 and ramps | Reference | “LEZ” fleet | Reduction |
|---|---|---|---|
| NOx | 327.92 kg | 130.81 kg | 197.11 kg (60.1%) |
| PMx | 20.64 kg | 16.33 kg | 4.30 kg (20.9%) |
| Hydrocarbons (HC) | 14.75 kg | 12.01 kg | 2.74 kg (18.6%) |
| Carbon monoxide (CO) | 668.51 kg | 625.61 kg | 42.90 kg (6.4%) |
| CO₂ | 168.40 t | 168.31 t | 0.09 t (0.1%) |
The reduction is particularly large for nitrogen oxides (NOx). Euro-standard replacement changes CO₂ much less in this calculation because fuel and electric shares, along with traffic, stay fixed. PMx means particulate mass emitted by vehicles in the SUMO model; these figures are neither ambient particulate concentrations nor a complete estimate of residents’ exposure.
Where are reductions greatest?
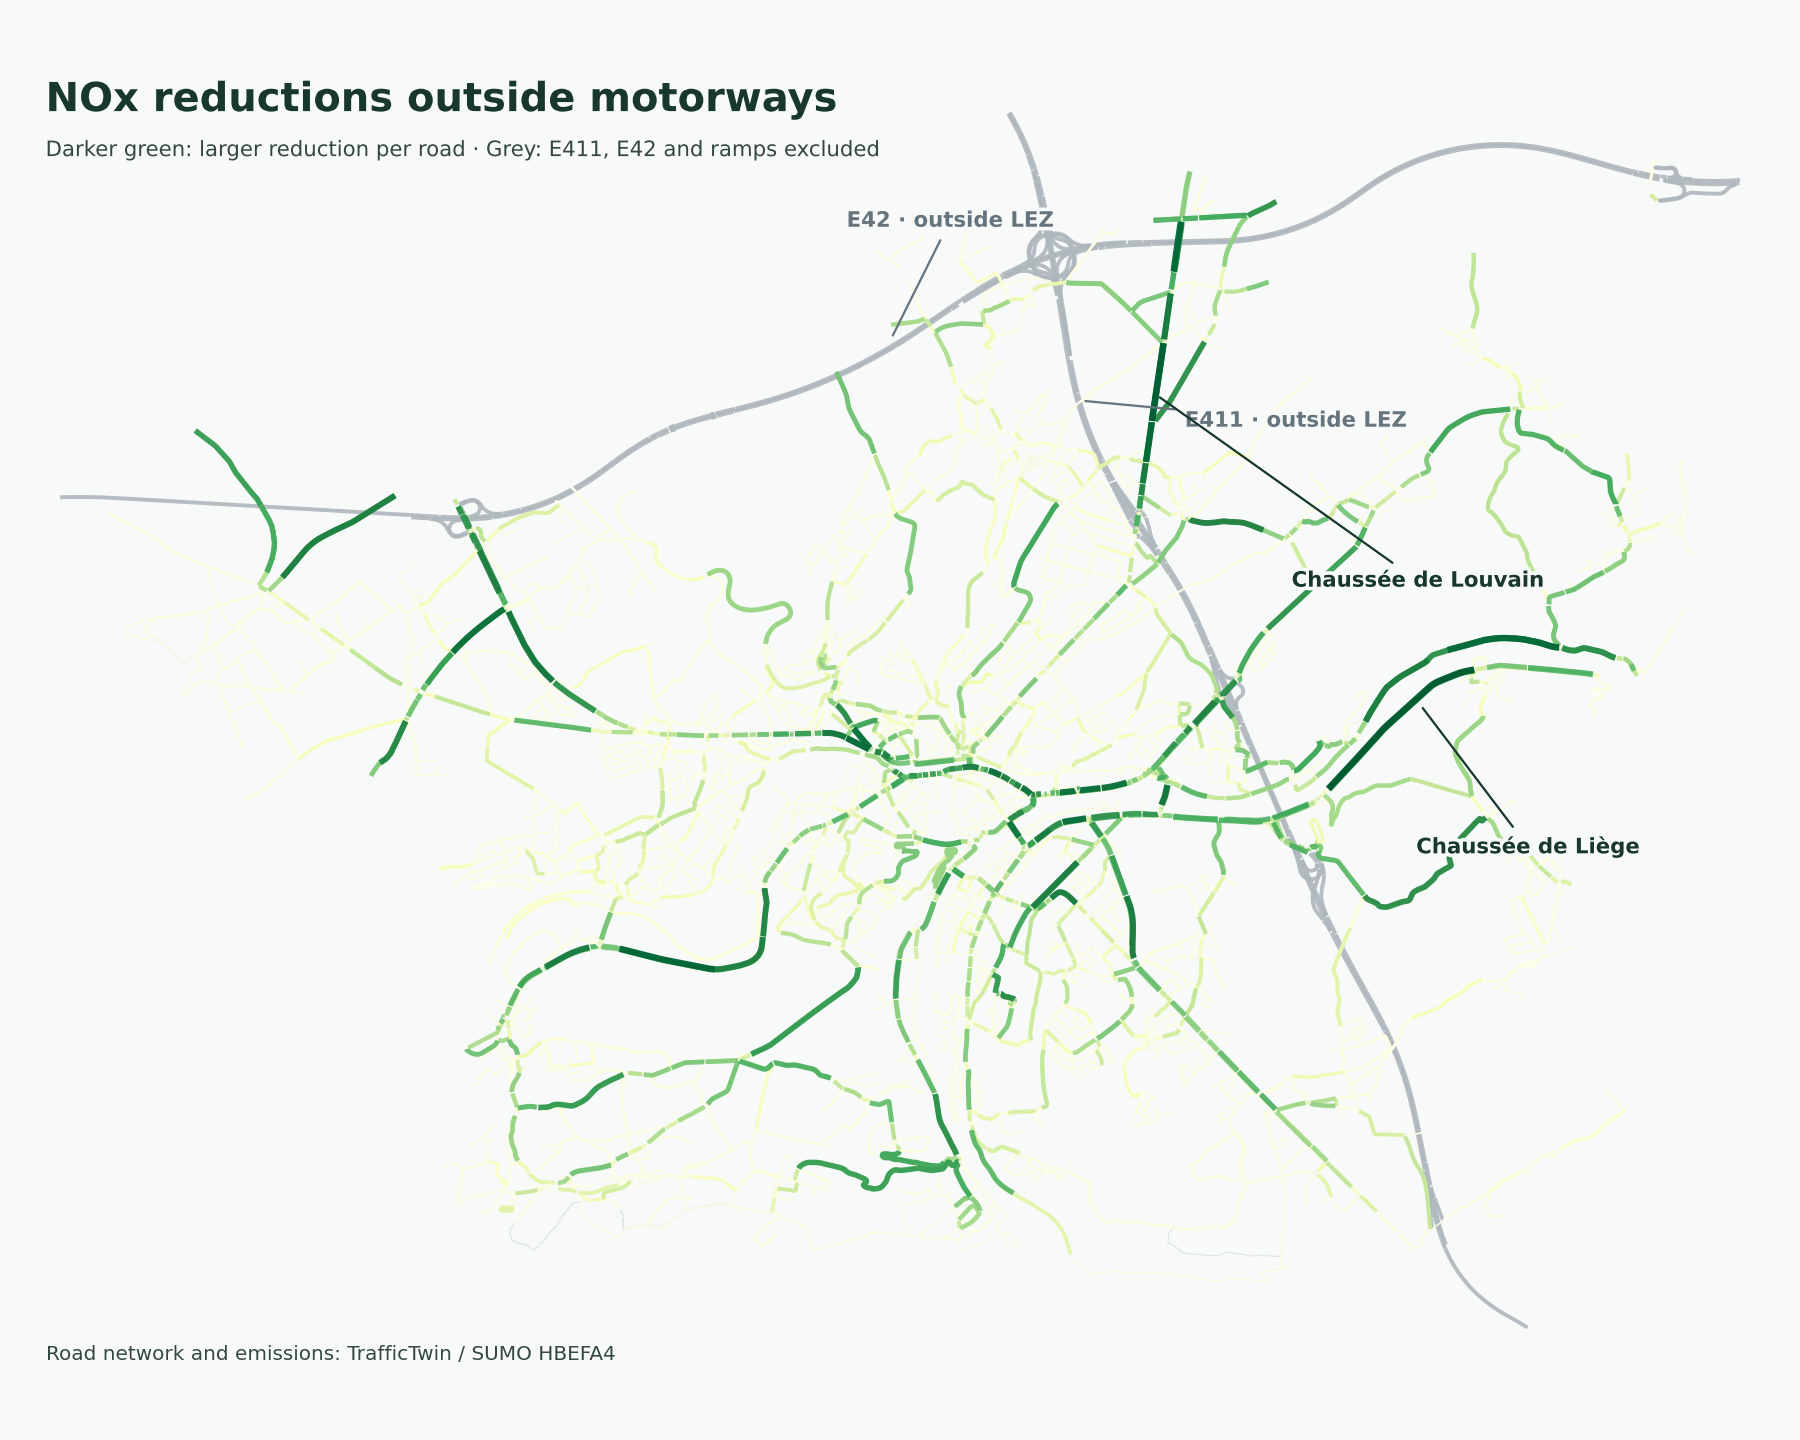
The map shows the absolute NOx reduction per non-motorway road segment over the day, calculated from the two fleet results and the simulation’s road geometry. The E411, E42 and their ramps are grey and do not contribute to the mapped reductions.
Among other roads, the largest cumulative reductions are on Chaussée de Louvain (16.4 kg), Chaussée de Liège (8.9 kg), Route de Hannut (8.4 kg) and Chaussée de Charleroi (8.2 kg). Avenue Albert Ier (7.1 kg) and Boulevard Cauchy (5.8 kg) also stand out. A large reduction in grams mainly indicates high initial emissions and substantial traffic; it does not directly measure the health benefit at that location.